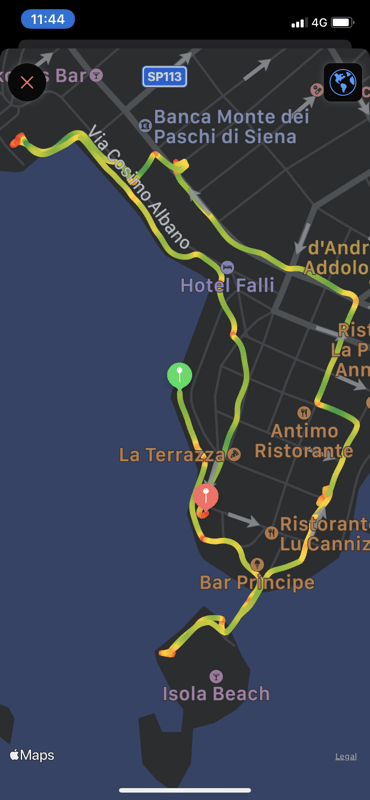
 I love the trail that the HealthFit App produces on the iPhone from my Workout app on the iWatch.
This trail is from a 2km stroll along the sea front at Cesarea on our little car tour of Puglia
I love the trail that the HealthFit App produces on the iPhone from my Workout app on the iWatch.
This trail is from a 2km stroll along the sea front at Cesarea on our little car tour of Puglia
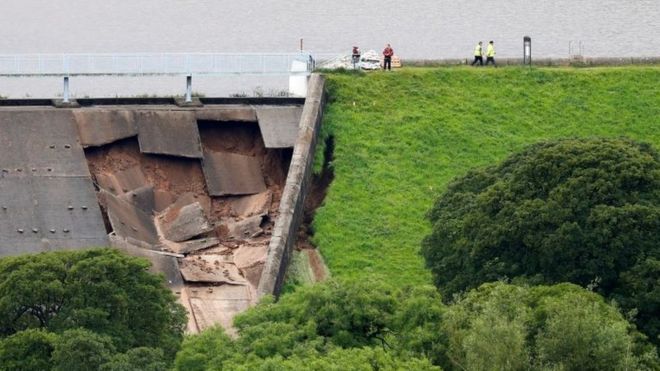 Interesting to find a couple of old reports on ‘freak weather’ in Whaley Bridge 147 years ago.
Whaley Bridge is mentioned twice in the flood chronologies for events in June 1872 and July 1881:
On 19th [June 1872] the Goyt was 12 to 14 feet above its normal level. At Whaley Bridge houses near the river were completely flooded and people were taken into the chapel and inns … in Macclesfield a woman and child were drowned when the river Bollin overflowed. Two reservoirs burst in the vicinity.
From: https://theconversation.com/heatwaves-and-flash-floods-yes-this-is-britains-new-normal-121351
The summer of 1872 was a wet and exceptionally thundery summer with frequent and at times severe thunderstorms.
Some reports of the thunderstorms that occurred during that summer.
18th June 1872
Chesterfield: Severe thunderstorm at night
Macclesfield: Thunderstorm lasting 12 hours.
From https://www.netweather.tv/forum/topic/62652-the-very-thundery-summer-of-1872/
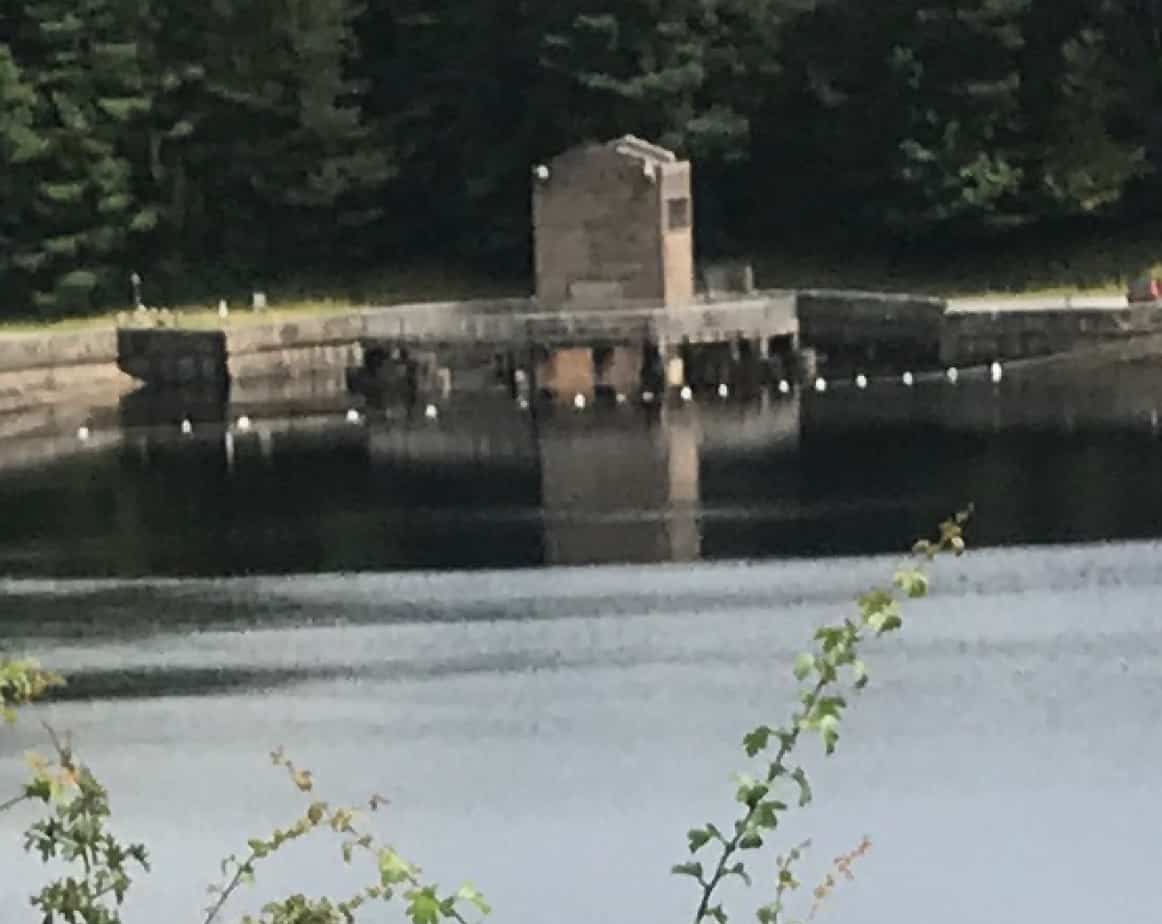 Still, we managed a quick ride from Buxton down The Goyt after a couple of very very wet days with the overflow at the Errwood Reservoir in full flow
Update 5 Aug 2019
December 1964
Toddbrook Incident date: December 1964 Construction details The reservoir was constructed in 1840-41 to supply water to the Peak Forest canal. It is on the north-west edge of the Peak District National Park near Whaley Bridge. The embankment is 24 m high with 1:2 upstream and downstream slopes. Further details of the dam construction are given in Incident No. 23. Incident description The water level was one metre above the spillway crest for a period of 24 hours following heavy rain and it took another two days for the level to fall to normal top water level. Damage was caused to the lower part of the spillway channel. Some parts of the side walls were washed out and some erosion took place on the right bank adjacent to the downstream toe of the dam.The main deterioration was caused by excessive flow down the spillway. Response The 1964 flood damage was repaired in 1965 and subsequent flood studies confirm the spillway was inadequate to take the design flood. An additional spillway was built in 1969 with a 75-m weir built over the southern section of the embankment discharging over a concrete-protected portion of the downstream face. The sill level is above the original spillweir level. Lessons The incident showed that despite the dam being in existence since 1840, the spillway was inadequate. The incident instigated a flood study of the reservoir resulting in an additional spillway constructed.
Charles, J Andrew; Tedd, Paul; Warren, Alan. “Delivering Benefits Through Evidence Lessons from Historical Dam Incidents”. environment-agency.gov.uk. Environment Agency. p. 140. Retrieved 1 August 2019.
From: https://obiterj.blogspot.com/2019/08/emergency-at-toddbrook-rservoir-whaley.html
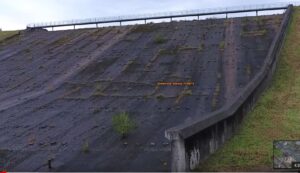
Left is an interesting video from Miles Haslam showing the spillway in August 2016 with a small tree growing in it at the point that recently failed ! and on the right with a photo during the recent overflow showing the same tree 3 years later! 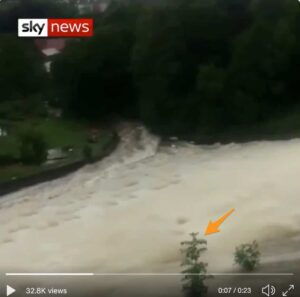
A lovely heatmap of my 800 cycling trips totalling over 40,000 miles since I joined Strava in July 2012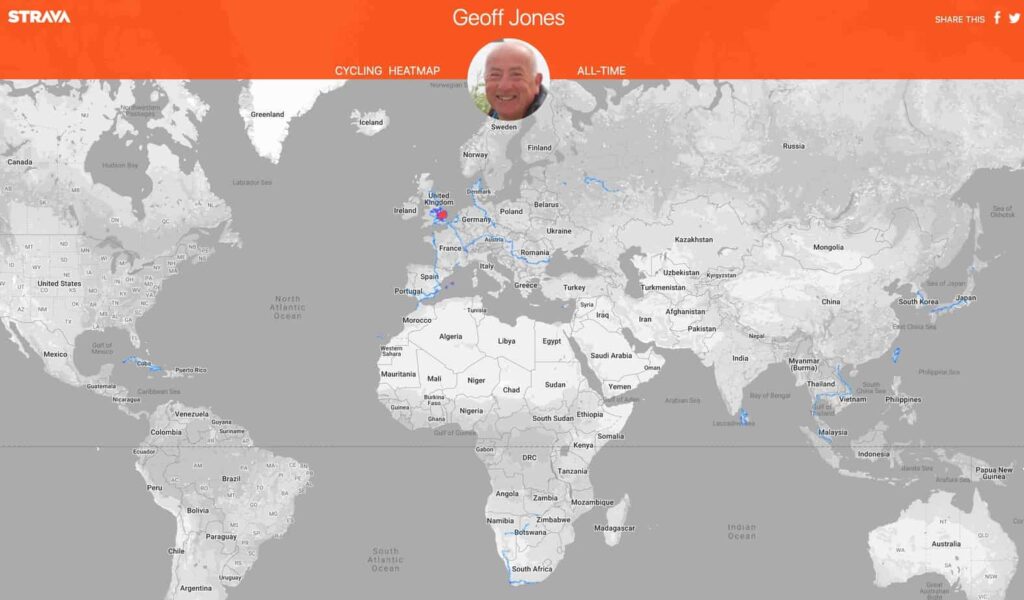
Clicking the map should let you zoom up and around.
Today’s reading rabbit hole which I disappeared into was driven by these articles all appearing in my Feedly :
A subject close to my heart 🙂 with my elevated blood pressure and after my carotid-femoral pulse measurements from the last Quantified Self conference I went too where they measured mine and found a stiff aorta 🙁 This sent me down the route of looking at other research papers eg here and here reminding me I’ve yet to find anyone in the UK who will measure it in a more controlled environment here in the UK rather than a conference hall in Copenhagen!
Interesting that they think that that the “antibiotic minocycline was highly effective in preventing hardening of the arteries”
This article visualises the +5000 years it took barley to reach the UK 🙂
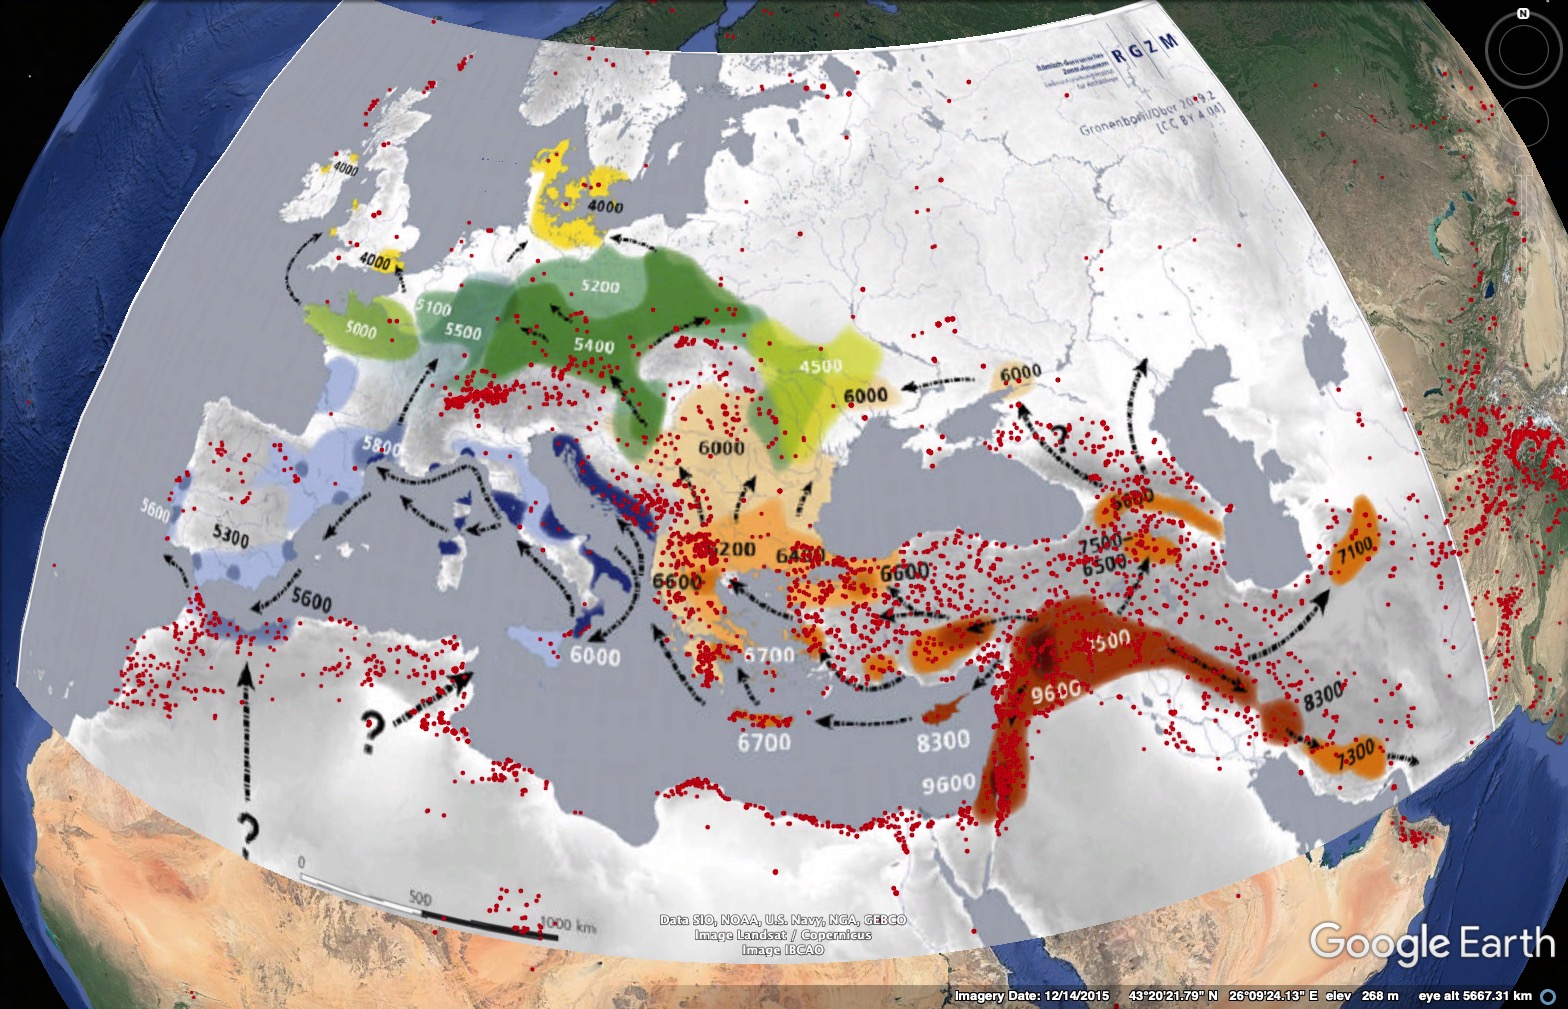
All very interesting particularly using the web site Map Warper to warp two maps together.
Mortality rates are still rising in the UK – and everyone is ignoring how many more people are dying.
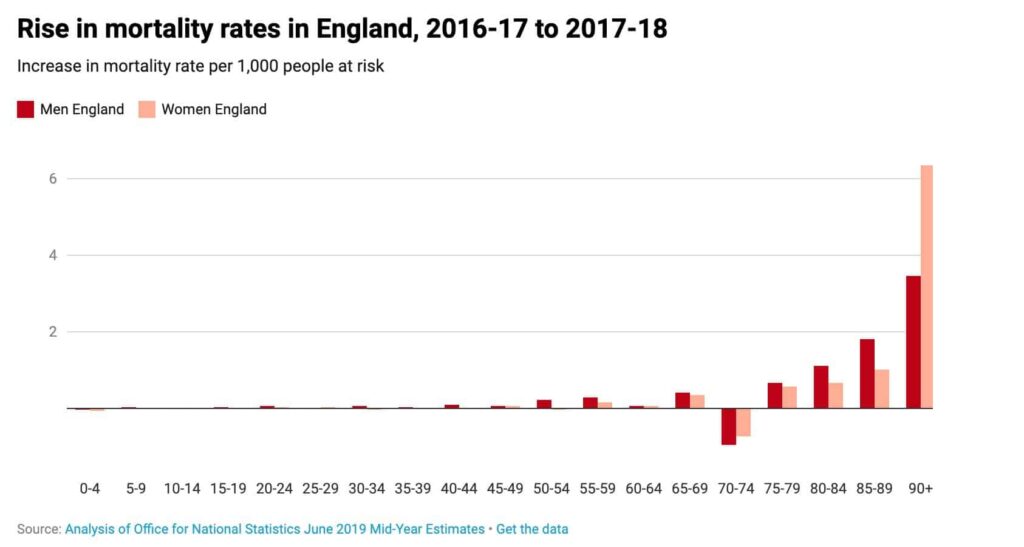 Interestingly my age group is still doing OK as you can see from the above chart.
As the article says:
Something is going very wrong. And whatever is going on is unique to the UK because in no other European country have there been overall falls in life expectancy that look at all like this. The figures for Scotland, Wales and Northern Ireland are almost certainly as bad as England, but no one has as yet bothered to study them in any detail – let alone tried to work out where they are heading.
Very interesting the full article is here
Whilst searching on the AllTrails website I discovered this little blast from the past which I uploaded to EveryTrail in 2008.
The original post came about when I discovered my 1956 YHA card. I then did a plot connecting up the Youth Hostels as much I could remember from when I was 8 years old. Staggering to think I did over 80 miles and all that climbing on a single speed bike 🙂 With my parents (late forties), brother (12) and sister (10)

A very interesting, for me, cluster analysis of my cycling speed versus distance made using the Strava Wind Analysis website
As you can see the shorter the distance ridden the slower I ride 🙁 Obviously when I’m touring on a loaded bike I ride much shorter distances.
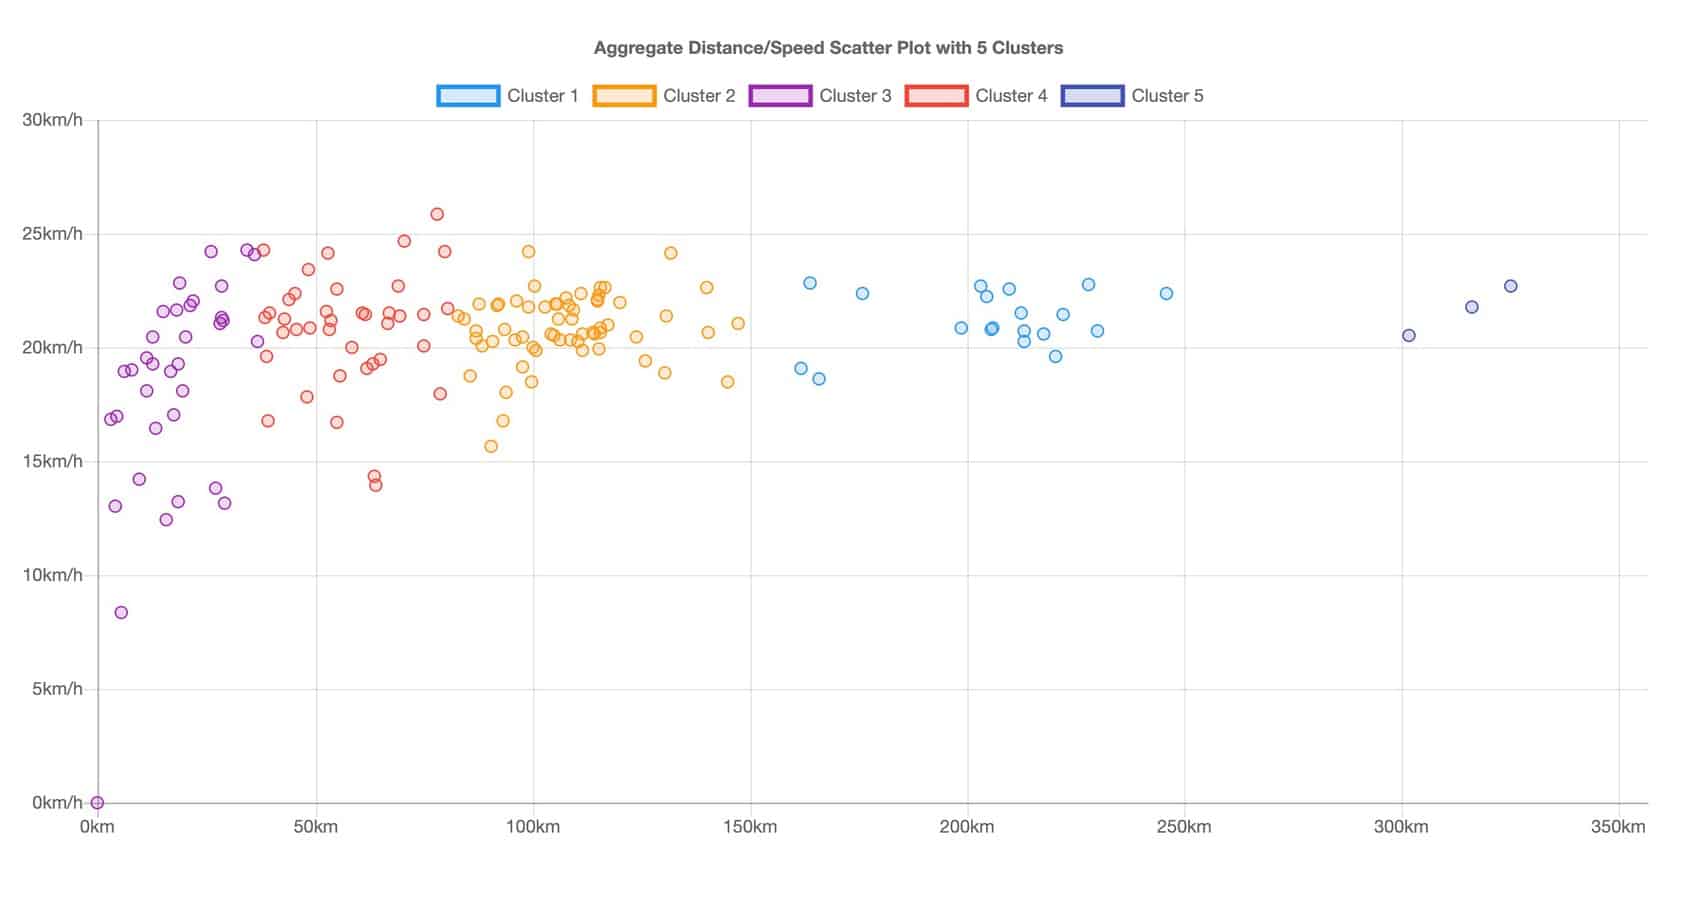
Interesting that my speed on Audaxes is always between 20 kph to 23kph irrespective of distance, well upto 300km 🙂 anyway.
The fastest ride is the 25.9kph ridden with Sally’s TTT group on my Fixie.
[mc4wp_form id=”18774″]
nbsp;
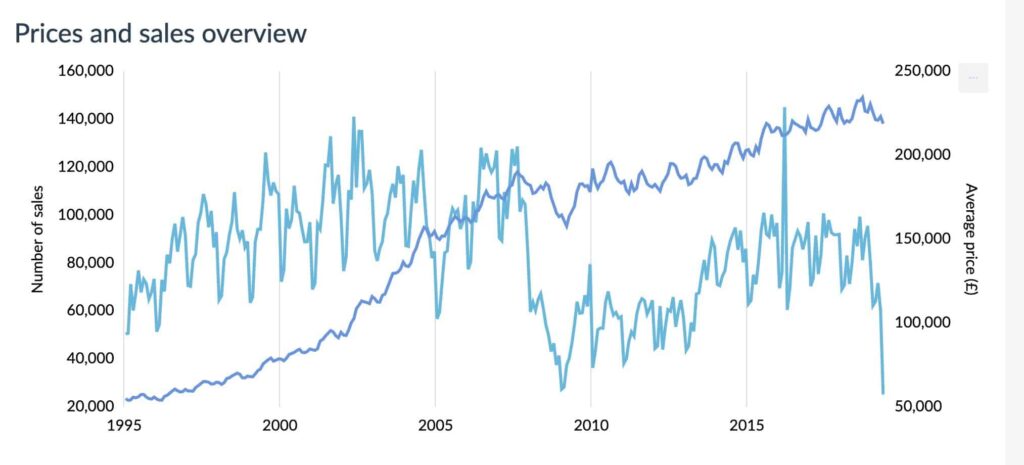
Interesting to see the latest number of UK House sales plotted by Dougal as you can see quite a cliff edge.
In May 2019 there were only 25,335 sales the previous lowest was in Feb 2009 with 28,507 sales. So this is the lowest monthly sales figures in at least 24 years! Will be very interesting to see when this gets reflected in price reductions.
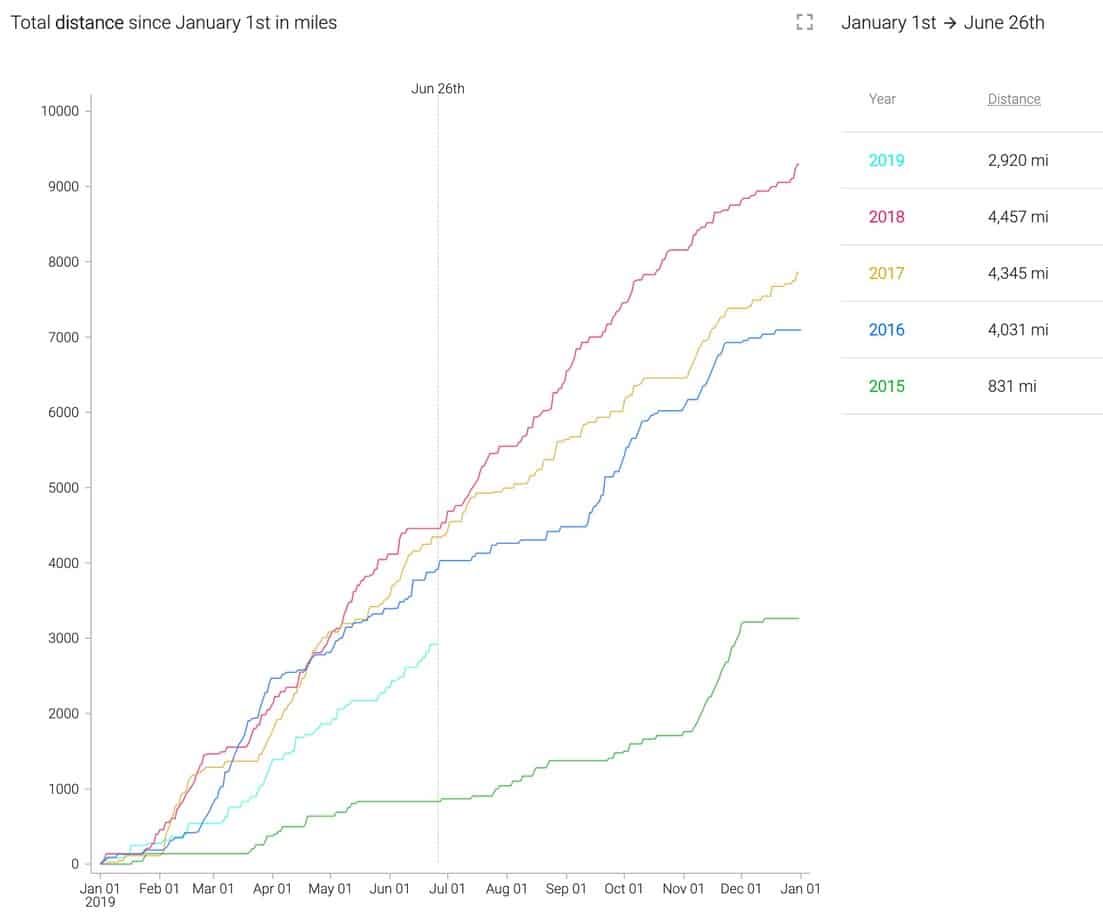
Using the excellent Chrome Elevate for Strava extension I have now produced this pretty chart.
As you can see my cycling distance is now down 1,537 miles from the same date in 2018, meaning if I’m to do the same mileage as last year I have to now pedal 6,374 miles in the remaining 188 days of 2019 or 34 miles a day 🙂
I had better leave the computer and get on the bike and do my 34 miles 🙂
Oops forgot the bike computer stuff was all in km so the ride was only 23.7 miles 🙁 instead of the required 54km
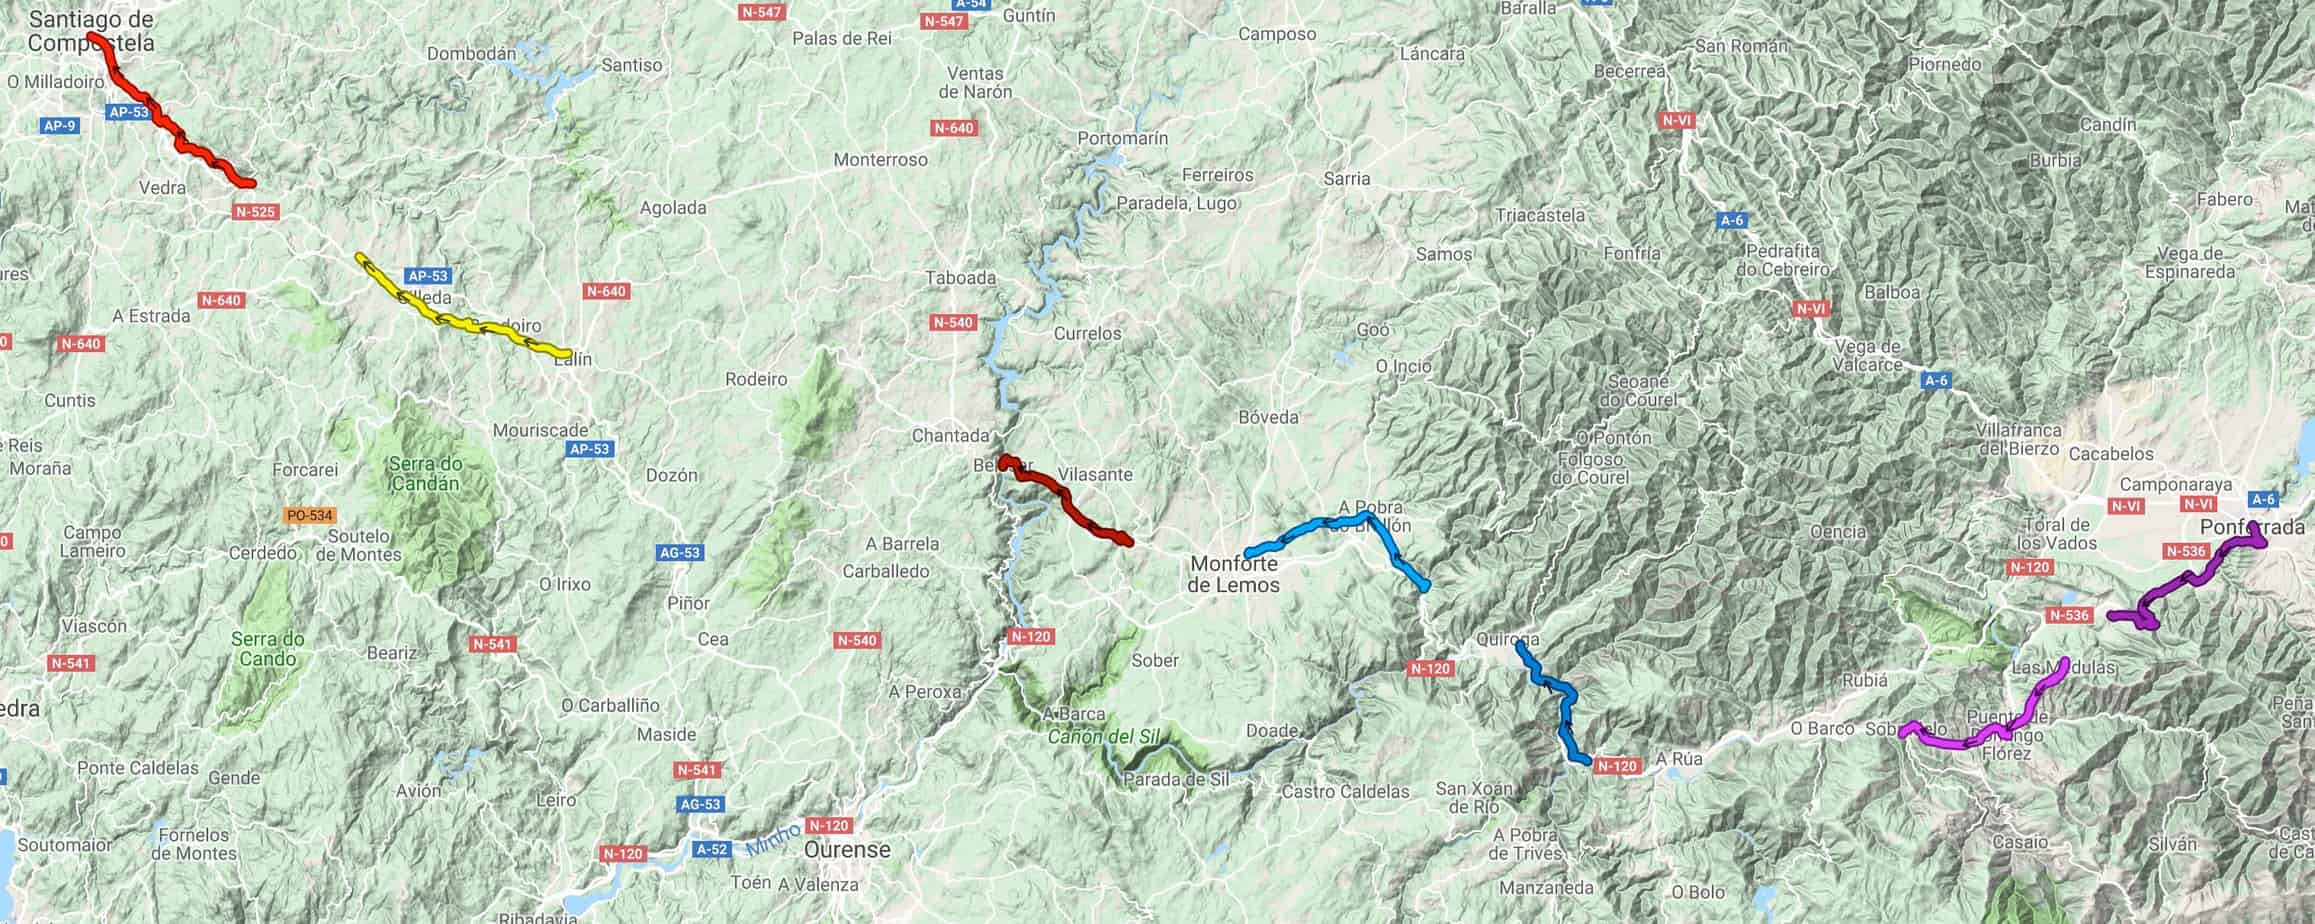
Finally 12 days after returning home from my Camino Invierno walk I’ve found a method of displaying all the sections where we walked on a zoomable embedded map 🙂 and amazingly also clearly showing all the bits we missed either intentionally or by error 🙁
The solution I found was to use the -umaps website which I found from this handy table on the OSM web wiki pretty straightforward to use as well.
&
Pretty impressive use of Open Street Map 🙂
The spreadsheet I created whilst away shows I walked about ⅔ of the route or about 90 miles in 7 walking days with over 10,000 feet of climbing, all very pleasant on very quiet tracks and roads so it makes a good alternative to the very busy Camino Francais, apart from the lack of accommodation on the route.
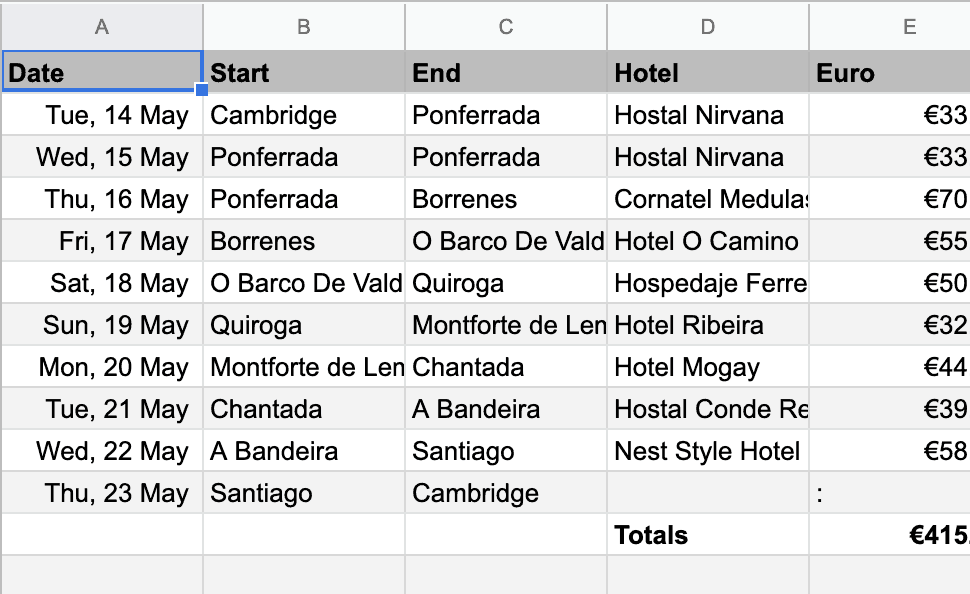
Use the spreadsheet to find all the relevant blog posts, Strava route details & my Flickr photos
Many thanks to Colin for the invite and organisational skills plus many thanks to German Geoff for staying with us even with his Achilles injury and supporting us with Colin’s car, certainly made it a lot easier!